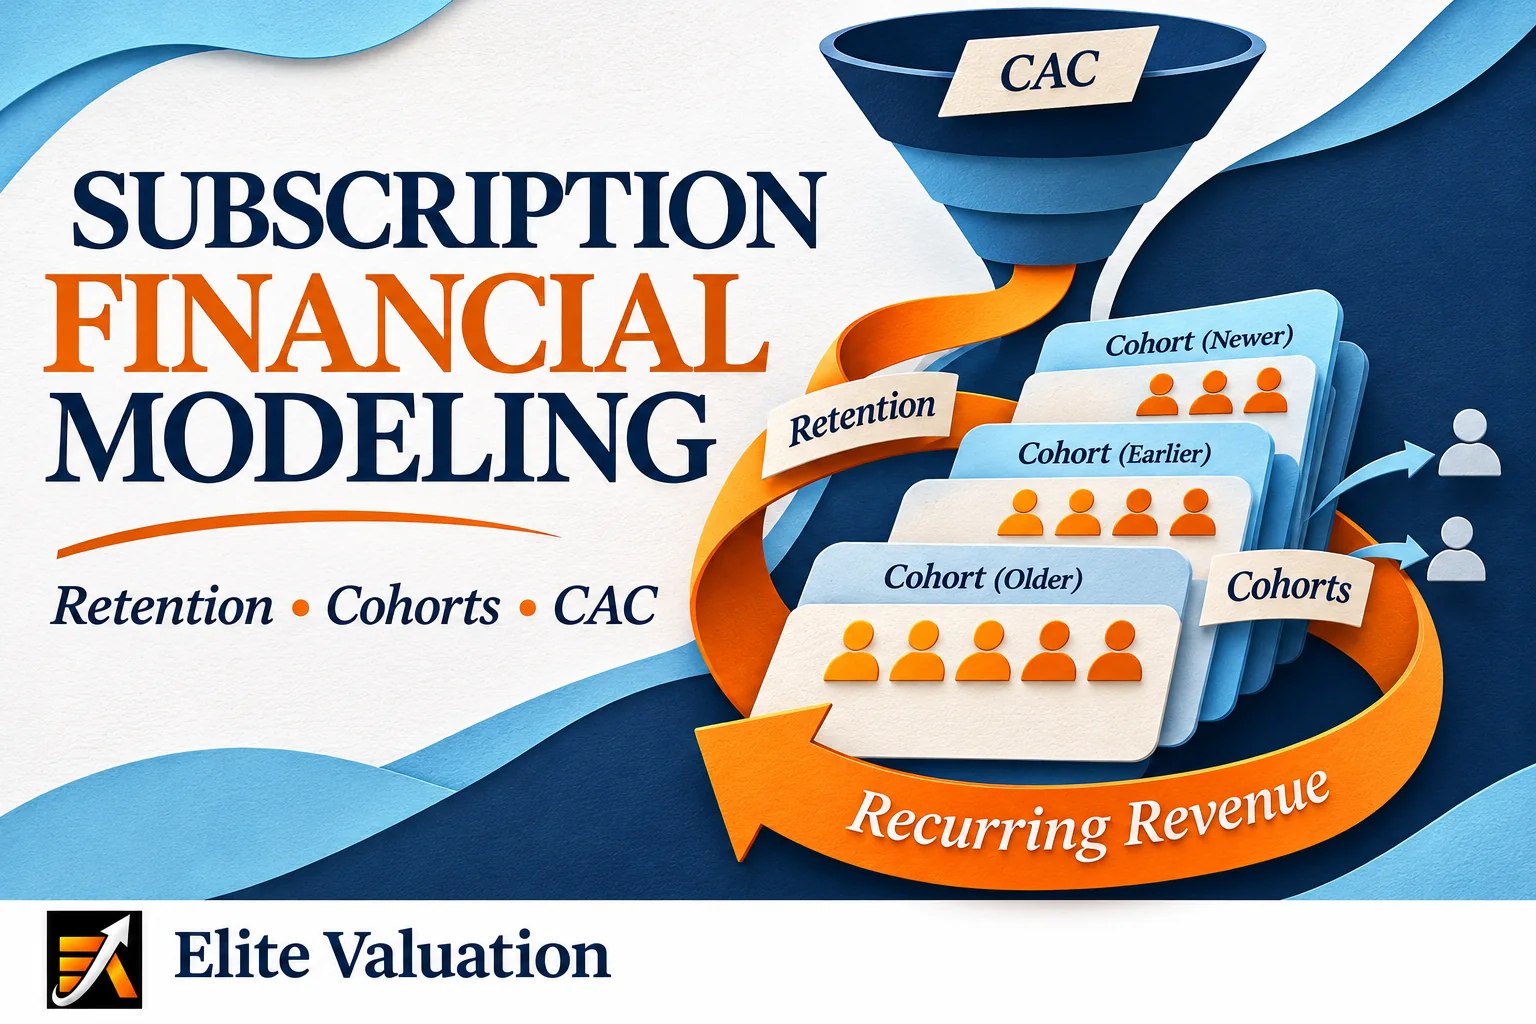
Subscription revenue looks steady on a dashboard, but the headline hides a flow of joiners and leavers. A brand that adds 2,000 subscribers a month and loses 1,500 is growing slowly, even while its monthly recurring revenue rises. Founders in Mumbai, Bengaluru and Delhi who sell boxes, memberships or content often find that their payback period is longer than the average customer stays. The model needs cohorts, churn curves and a margin per order, so that growth can be judged for each group of customers. Below we set out how to build those pieces and how they feed profit and cash.
Key takeaways
- Track monthly recurring revenue (MRR) by cohort, so that growth from new customers can be separated from the retention of existing ones.
- Build retention curves from the signup month. An average across all customers hides whether recent cohorts are better or worse than older ones.
- Report subscriber acquisition cost (SAC) by channel alongside blended CAC, because a blended figure that includes organic signups can make paid growth look cheap.
- For physical subscriptions, the margin after product, packaging, shipping and payment costs decides whether each new customer can pay back its acquisition cost.
- Model pauses and cancellations as separate flows. A pause keeps the customer on the books, while a cancellation removes the MRR.
Subscription Economics Beyond B2B SaaS (D2C, Media, and Boxes)
Consumer subscriptions differ from B2B SaaS in price point, churn and margin. A monthly box or membership has a physical cost of delivery and a shorter customer life. The model must carry product and fulfilment costs and test churn more closely than a software model needs to.
The Importance of Monthly Recurring Revenue (MRR) in Consumer Models
Monthly recurring revenue (MRR) is the value of active subscriptions expressed per month. It equals the number of active subscribers multiplied by the average monthly price, after discounts and before one-off fees. In a consumer model, MRR should be built from the subscriber count and the plan mix, not typed in as a growth figure. Split the monthly change into new MRR, expansion, contraction, churned MRR and reactivated MRR. Those flows explain the movement from one month to the next, and they show what the business must replace each month to keep growing.
A consumer subscription often has several plans, a free trial and introductory pricing. Model each plan and each promotion separately. Average revenue per user can rise because customers move to a higher plan, or because a discount ends, and not because the product is worth more. An investor in Bengaluru or Mumbai will ask which of those is happening before accepting the trend.
A Delhi wellness subscription reports MRR of Rs 60 lakh, up Rs 10 lakh in the month. Its model splits the change into Rs 12 lakh of new MRR, a Rs 6 lakh loss from churn and a Rs 4 lakh gain from introductory discounts that ended during the month. The founder sees that the underlying growth is slower than the headline figure.
Cohort Analysis: The Heart of the Subscription Model
A cohort is the group of customers who subscribed in the same month. Tracking each cohort’s retention over time shows whether the business is improving. It also lets the model forecast the subscriber base from the curves of cohorts already signed up, rather than from one average churn rate.
Tracking Customer Retention Rates by Signup Month
Build a cohort table with signup month in the rows and months since signup in the columns. Each cell shows the share of the cohort still subscribed after that many months. Read across a row to see the life of one group, and down a column to compare groups at the same age. A healthy business shows each new row retaining at least as well as the one before. A row that falls faster than its predecessors is an early warning, often caused by a product change, a new acquisition channel or a price increase.
Use the same definitions in every row. A customer who pauses should be treated the same way each time, and a reactivated customer should count as the same subscriber, not as a new one. If the product is sold in several cities, show the retention for a Mumbai cohort beside one from Pune or Ahmedabad, because local pricing and delivery can change the curve.
A Pune snack box brand’s cohorts from January to June keep 62 per cent of subscribers at month three. The July and August cohorts keep 48 per cent, after a price rise and a move into paid channels that brought in more price-sensitive buyers. The forecast uses the newer curve, not the blended average the founder had been quoting.
Forecasting Subscriber Degradation Curves
A degradation curve shows how quickly a cohort loses subscribers over its life. Most consumer cohorts lose the largest share in the first few months and then flatten, although the shape varies by product. Fit the curve to observed cohorts, then apply it to the signup plan for newer cohorts. Show a fast-churning case and a slow-churning case as well, so the forecast does not rest on a single line.
Use the curve to give active subscribers in each month. Multiply those by average MRR to forecast revenue, and by the margin per order to forecast contribution. Keep the curve as an input table with its source cohorts noted, so a reviewer can see what the forecast rests on.
A Gurugram media subscription loses 30 per cent of each cohort in its first month and 10 per cent in each month after that. Applied to planned signups of 5,000 a month, the curve shows active subscribers rising more slowly than the signup plan suggests, because early churn absorbs much of each intake.
Struggling to calculate your D2C subscription cohort retention?
Let Elite Valuation build a cohort model that shows retention by signup month, channel and plan, so the forecast rests on your own data.
Discuss your cohort modelFinancial Modeling | Cohort Analysis | D2C Retention
Marketing Efficiency and Profitability
Marketing efficiency is measured by what a subscriber costs to win and how long contribution takes to repay that cost. Subscriber acquisition cost (SAC) should be read against blended CAC, and the payback period tells the founder whether cash comes back before the customer leaves.
Subscriber Acquisition Cost (SAC) vs. Blended CAC
Subscriber acquisition cost (SAC) is the paid acquisition spend in a period divided by the new subscribers that spend brought in. Blended CAC divides total sales and marketing cost, including the team and organic efforts, by all new subscribers. Organic signups can lower blended CAC, although the result also depends on which costs are included. Paid SAC helps the founder assess paid acquisition efficiency; the cost of additional growth can change as spending scales. Report both, with the split by channel, so that a fall in blended CAC caused by more organic signups is not mistaken for cheaper paid acquisition.
The conversion window matters too. A free trial that converts to paid after 14 days means spend in one month pays back in the next. Match spend to the subscribers it produced within the window, and state the window used.
A Bengaluru box brand spends Rs 18 lakh on paid media in a month and gains 1,200 paying subscribers from it, a paid SAC of Rs 1,500. Total marketing and team cost for the month is Rs 19.8 lakh, spread over 2,200 new subscribers, so blended CAC is Rs 900. The model reports both, and the founder sets the growth budget on the paid figure.
Modeling the Payback Period in Low-Margin D2C Subscriptions
Payback period is the acquisition cost divided by the monthly contribution per subscriber, in months. For a low-margin D2C subscription, payback can run longer than the average customer stays, so each new cohort needs more cash than it returns in its early months. Model payback by cohort and by channel, and show the share of subscribers who have repaid their cost by each month, rather than one average. A plan in which payback exceeds the average life should explain how the gap is funded.
Show the cash effect of the gap. The model should track the cumulative cash of each cohort, the month in which it turns positive, and the peak funding needed across all cohorts at once.
A Gurugram skincare subscription has a SAC of Rs 1,200 and a monthly contribution of Rs 150 per subscriber, which gives a payback of eight months. Average subscriber life is six months, so the average cohort does not repay its cost. At a constant Rs 150 monthly contribution over six months, a subscriber contributes Rs 900 against Rs 1,200 of acquisition cost, leaving a Rs 300 shortfall. The total funding need also depends on signup volumes, timing and working capital.
Inventory and Fulfillment Considerations (For Physical Subscriptions)
For a physical subscription, each delivery carries product cost, packaging, shipping and handling, and sometimes returns. These costs set the gross margin per order. Inventory bought ahead of demand ties up cash as well, so the model should show both, because a box business can grow fast and still run short of cash.
Factoring Shipping, Packaging, and COGS into Gross Margin
Gross margin per order equals the price charged per box, less the cost of goods, packaging, pick and pack, shipping and payment fees and discounts. A box that sells for Rs 999 a month, with Rs 450 of product, Rs 80 of packaging, Rs 120 of shipping and Rs 40 of payment and handling, leaves a gross margin of Rs 309, or about 31 per cent. Model each cost as its own line and tie it to volume and to the weight of the box, because shipping rates and packaging costs move with both.
Inventory is the other cash cost. A box business buys stock ahead of its deliveries, so the forecast subscriber count sets the purchase plan. Brands in Pune and Bengaluru often hold stock in weeks of cover. Show the cover, the supplier terms and any minimum order quantities, because a forecast that is too high leaves cash in unsold stock, and one that is too low loses subscribers.
A Mumbai beauty box has a planned intake of 8,000 subscribers and orders stock for 10,000 to allow for growth. The extra 2,000 units at Rs 450 each tie up about Rs 9 lakh of cash for three months. The plan sets a reorder point linked to the actual subscriber count each week, so the buffer does not grow by default.
Want to know whether each physical box makes money?
Talk to Elite Valuation about a margin analysis that covers product, packaging, shipping and payment costs for every order.
Speak with Elite ValuationFinancial Modeling | Unit Economics | Margin Analysis
Frequently Asked Questions (FAQs)
How is cohort analysis used in subscription financial modeling?
Cohort analysis groups subscribers by the month they joined and tracks the share of each group still paying over time. The model uses those curves to forecast the active base from the signup plan, so revenue reflects the retention the business has actually achieved. It also shows whether newer cohorts retain better or worse than older ones, which a single average churn rate hides.
What is the difference between blended CAC and paid CAC?
Blended CAC divides total sales and marketing cost by all new customers, including those who arrive organically. Paid CAC divides only the paid acquisition spend by the customers that spend brought in. Paid CAC helps assess paid-channel acquisition efficiency, while blended CAC shows the overall acquisition cost across channels. Report both, with the split by channel and the conversion window used.
How do you forecast churn for a newly launched D2C subscription?
A new product has no cohort history, so start from a benchmark range and from the churn of the closest comparable product you can find, then revise the curve as cohorts mature. Model a fast and a slow churn case, and update the forecast each month as real cohorts arrive. Early churn is usually the highest, so the curve should reflect the first three months of actual data as soon as they exist.
Why is the CAC payback period longer for physical subscription boxes?
A physical box carries product, packaging and shipping costs with every delivery, so monthly contribution per subscriber is lower than for a digital product at the same price. Lower contribution stretches the payback period. Calculate payback by cohort and by channel, and check that the average subscriber stays long enough to repay its acquisition cost.
How do you calculate lifetime value (LTV) for a consumer subscription?
LTV is the contribution a subscriber produces over its expected life. With constant monthly contribution, it equals that contribution multiplied by expected paid subscriber life. The reciprocal of monthly churn is a simplified life estimate only when churn is constant and the timing convention is consistent. For age-varying retention, sum expected contributions using the cohort survival curve. Use contribution after product, delivery and payment costs, not revenue. Base the life on cohort curves rather than a fixed assumption, and show LTV against CAC so the ratio can be tested.
What is the impact of pausing vs. canceling subscriptions on MRR?
A pause keeps the customer on the books but removes billing for the paused months, so it reduces MRR for a time and may return later. A cancellation removes the subscriber and its MRR, and a later return counts as a reactivation. Model pauses and cancellations as separate flows, and show the share of paused subscribers who come back, because a high pause rate can make MRR look weaker than the customer base really is.
How do you value a media/content subscription business?
Media subscriptions are often valued on recurring revenue and on the retention of the subscriber base, after deducting the cost of content and the marketing cost of each subscriber. The method depends on the stage of the business and on the quality of the cohort data. A discounted cash flow built from the cohort forecast is a useful basis, and a comparison with recent transactions in the sector is a cross-check. Explain the weights and the range, so the Valuation can be tested.
How should advance subscription payments be modeled?
Separate cash collection from revenue recognition. Record advance receipts as a contract liability until the relevant goods or services are delivered, applying the appropriate revenue-recognition policy. Model tax and GST cash flows separately from accounting revenue: their timing depends on the transaction and applicable rules. Agree those assumptions with the company’s accountant or tax adviser rather than automatically using the revenue-recognition schedule.
Growing a subscription business?
Contact Elite Valuation to discuss a financial model covering your subscribers, your acquisition spend and your funding needs.
Contact Elite ValuationFinancial Modeling | MRR | Fundraising
Sources
- Ind AS 115, Revenue from Contracts with Customers, as notified by the Ministry of Corporate Affairs, read for over-time recognition and contract liabilities on advance payments.
- Income-tax Act, 2025, effective 1 April 2026, per the Central Board of Direct Taxes press release: incometaxindia.gov.in
- GST on supplies of goods and services, read for the general position on the timing of supply. Specific rates and conditions are not restated in this article.

Disclaimer. This article provides general information, not legal, tax, accounting or investment advice. The scenarios and figures are hypothetical illustrations, not client results or industry benchmarks. Revenue recognition, tax treatment and financial-model assumptions depend on the business and transaction. Obtain advice appropriate to your circumstances.