Most SaaS founders do not lose a funding round because the product is weak. They lose it because the model behind the deck does not hold together. Revenue grows in one tab, headcount sits in another, and cash is never checked against either. An investor who opens the file sees the gap within minutes. This guide sets out how we would build the model for a SaaS company raising money in India: which metrics carry the weight, how to forecast from the sales engine upwards, and which benchmarks help and which are only rules of thumb.
Key takeaways
- A SaaS model is a subscription model first. Billing in advance, revenue recognised over the term and cash timing are three different things, and the model should show all three.
- Forecast bottom up from pipeline, pricing, conversion, sales capacity and churn. A share of a large market will not survive a diligence call.
- ARR, MRR, NRR and GRR need one set of definitions across the deck, the model and the data room.
- CAC payback and the LTV-to-CAC ratio are useful only when CAC includes the full cost of acquiring a customer.
- The Rule of 40 and revenue multiples are conversation starters. Growth, retention and margin decide where a company sits within any range.
The Core Mechanics of SaaS Financial Modeling
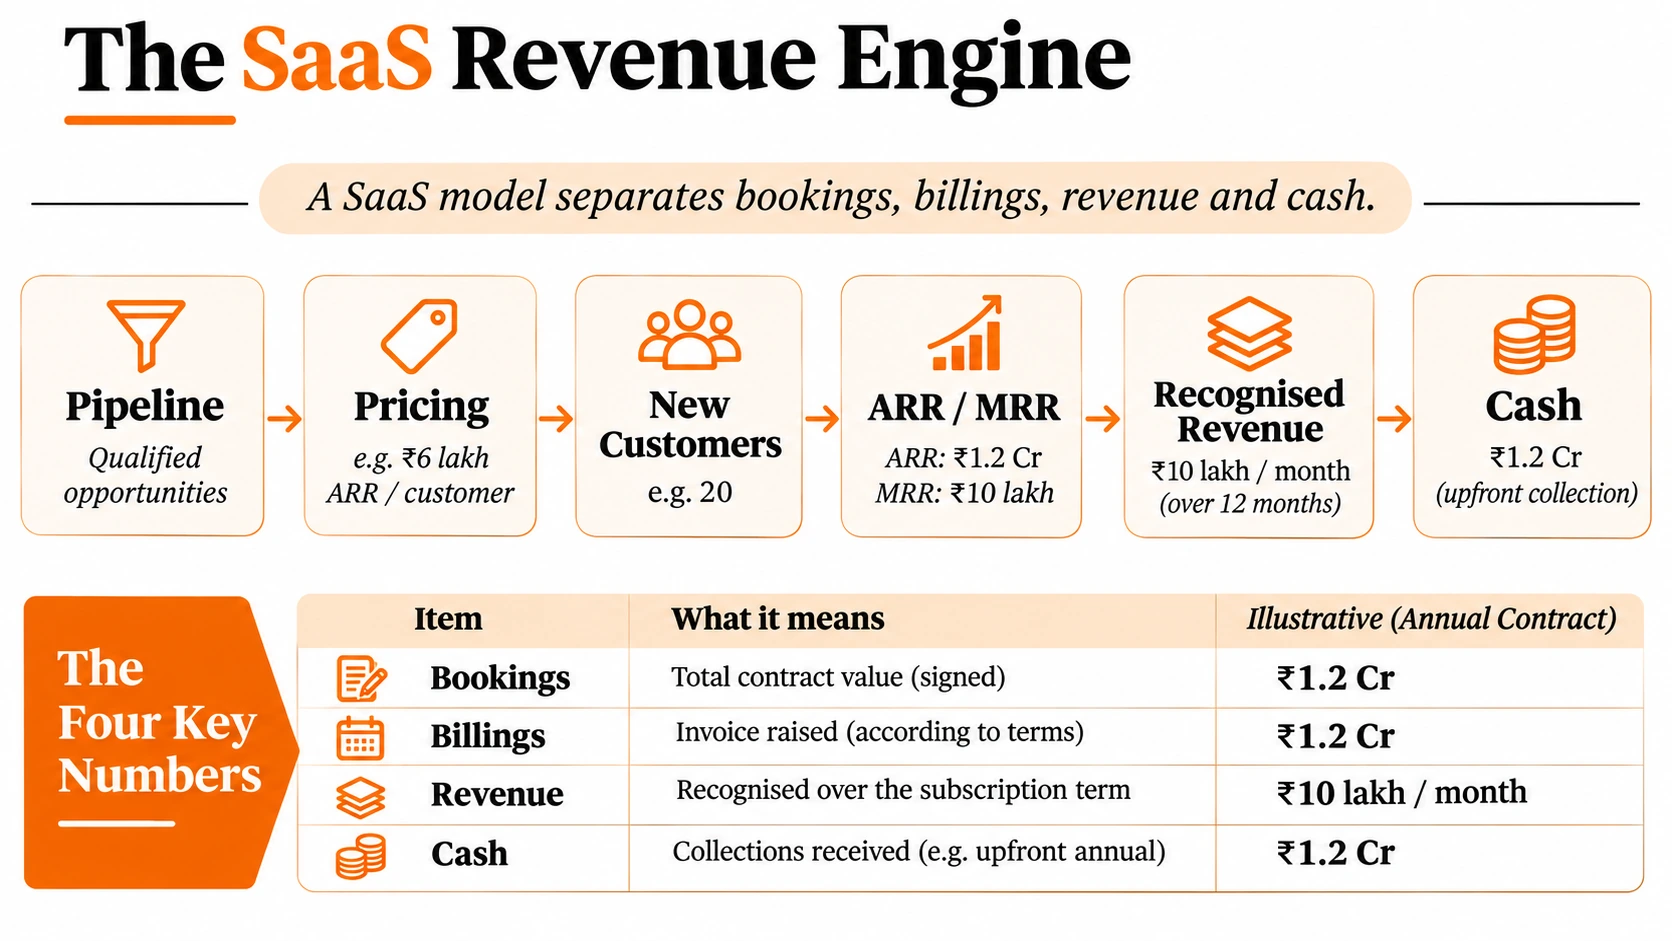
A SaaS financial model separates bookings, billings, revenue and cash. A customer who pays annually in advance gives the company cash today, while revenue arrives month by month over the subscription term. A model that starts from the profit and loss statement misses the cash position that decides how long the company can grow before it needs more capital.
Shifting from Traditional Accounting to Subscription Economics
A manufacturer sells a product, records the sale and collects the cash, usually in that order. A SaaS company sells access over time. Under Ind AS 115, revenue from a subscription is recognised as the service is delivered, so a Rs 12 lakh annual contract adds about Rs 1 lakh of revenue a month, whatever the invoice says. The invoice matters for cash. If the customer pays the full year in advance in April, the company holds Rs 12 lakh of cash and a contract liability that falls by Rs 1 lakh each month.
This split changes what the model has to show. Founders in Bengaluru and Mumbai often present revenue growth as proof of traction, yet a company can grow revenue quickly while its runway shortens, because it pays sales commissions and hosting costs up front and collects over a longer period. We build three lines separately: contracted ARR and bookings, billings and collections, and recognised revenue. The balance sheet carries the deferred revenue, so cash and profit can be reconciled every month.
A Pune software company signs twenty annual contracts at Rs 6 lakh each in one quarter. Recognised revenue for that quarter rises by about Rs 15 lakh if the contracts start halfway through it, yet collections rise by Rs 120 lakh if every customer pays up front. A model that shows only the revenue line makes the runway look either far shorter or far longer than it is, depending on the collection terms, and an investor will ask which one is right.
Bottom-Up Forecasting vs. Top-Down Market Sizing
A top-down forecast starts with a large market number, takes a share that looks modest and multiplies. A market of Rs 50,000 crore with a 1 per cent share gives Rs 500 crore of revenue, and the model stops there. Investors have seen this many times and discount it heavily, because the share assumption carries the whole forecast and nothing in the model says how the company will win that share.
A bottom-up forecast builds revenue from the sales engine. It starts with the number of sales representatives, the ramp time before each one is productive, the opportunities each representative works, the win rate by segment, the average contract value and the churn of the existing base. Each input can be tested against actual data from the last six to twelve months. When a founder says the company will add 40 customers next quarter, the model should show which representatives create them and what they close.
We still use market sizing, but only as a sense check. If the bottom-up plan implies a share no comparable company has reached in a similar time, the plan needs another look. Keep the market figure in an appendix and name its source.
Key Revenue Drivers and Growth Metrics
Annual recurring revenue (ARR) and monthly recurring revenue (MRR) measure the contracted subscription base. Net revenue retention (NRR) and gross revenue retention (GRR) show how much of that base stays, and how much grows, from one year to the next. Define all four once and use them the same way in the deck, the model and the data room.
Annual Recurring Revenue (ARR) and Monthly Recurring Revenue (MRR)
MRR is the recurring fee a customer pays each month. ARR is MRR multiplied by twelve for monthly contracts, or the annualised value of the contracted fee for annual ones. The two should move together, and any gap between them needs an explanation. One-time implementation fees, professional services and usage charges that change month to month belong outside ARR, unless the contract guarantees a minimum.
Most disputes in diligence come from definitions. A company that counts a pilot in ARR, or keeps a customer who has given notice of cancellation, will be asked to restate. Set the rules early. A contract enters ARR when it is signed and live, leaves when notice takes effect, and is adjusted for any discount that runs beyond the first year. Keep a monthly ARR bridge that shows new, expansion, contraction and churned ARR, because the bridge is the first thing an investor reads.
A Mumbai SaaS company reports ARR of Rs 4 crore. Its bridge shows Rs 90 lakh of new ARR, Rs 20 lakh of expansion, Rs 15 lakh of contraction and Rs 35 lakh of churn over the year. The bridge says more than the closing figure does, because it shows whether growth comes from new logos or from existing customers spending more.
Net Revenue Retention (NRR) and Gross Revenue Retention (GRR)
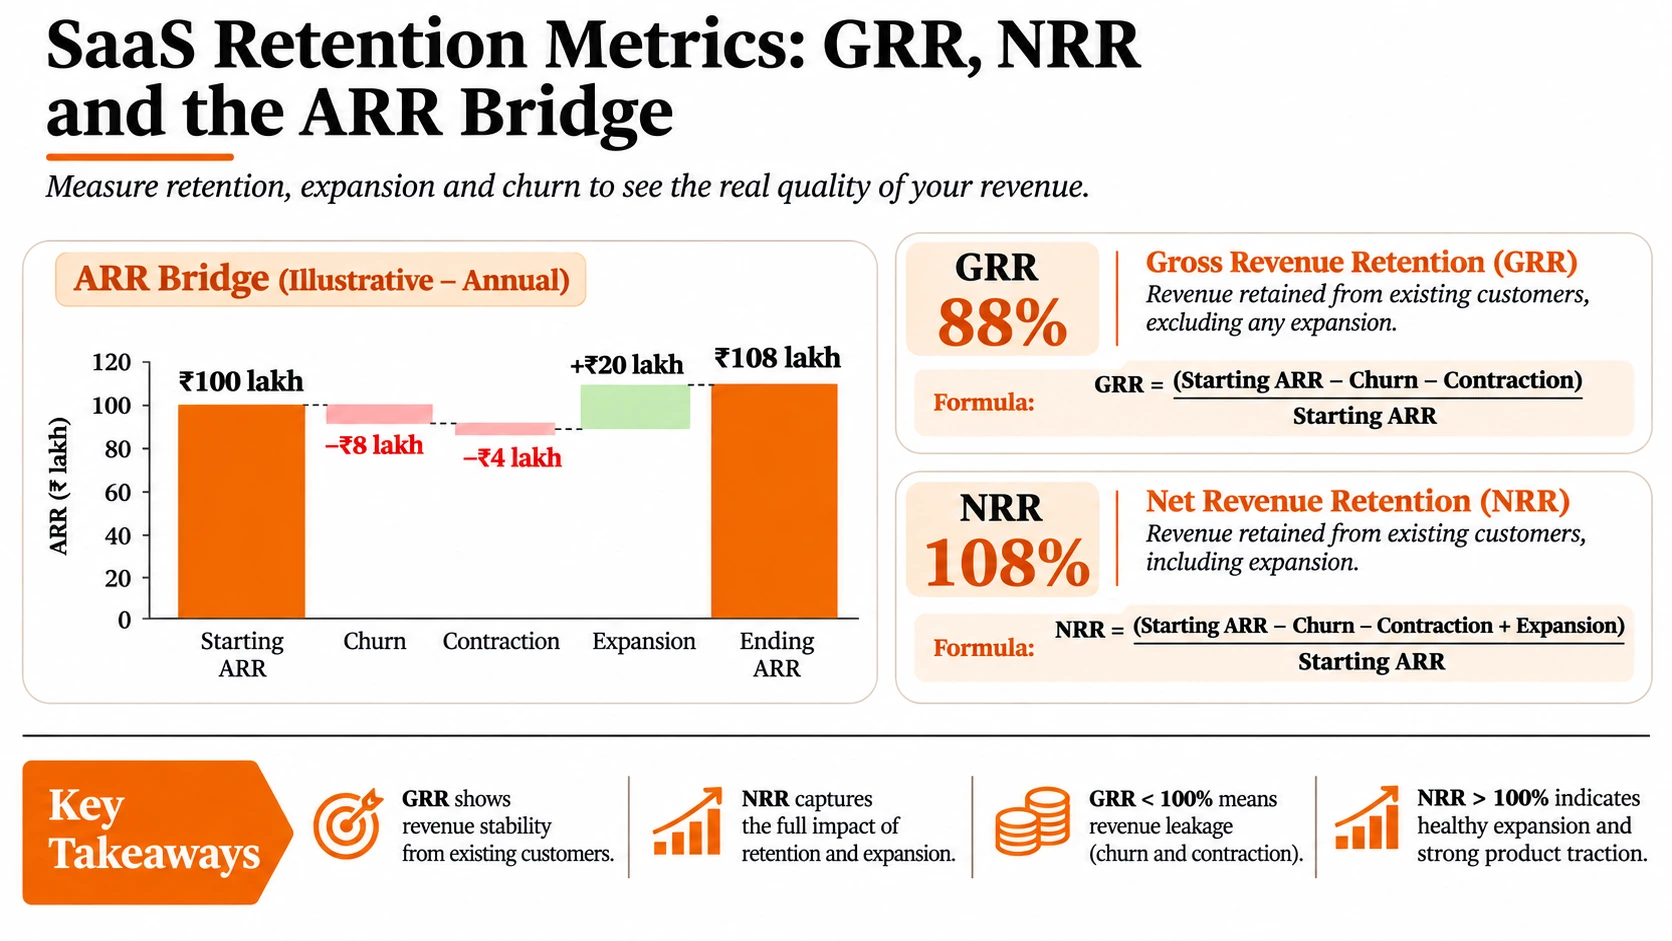
Gross revenue retention measures what remains of a starting cohort after churn and contraction, before any expansion. It cannot exceed 100 per cent. Net revenue retention adds the expansion revenue from the same customers. Take a cohort that starts at Rs 100 lakh of ARR. If churn removes Rs 8 lakh and contraction removes Rs 4 lakh over twelve months, GRR is 88 per cent. If the same customers add Rs 20 lakh through upsells, NRR is 108 per cent.
| Item (cohort starting ARR Rs 100 lakh) | Amount (Rs lakh) | Effect |
|---|---|---|
| Churned customers | -8 | Reduces GRR and NRR |
| Contraction | -4 | Reduces GRR and NRR |
| Expansion | +20 | Raises NRR only |
| GRR | 88% | (100 – 8 – 4) / 100 |
| NRR | 108% | (100 – 8 – 4 + 20) / 100 |
Investors read the two numbers together. A high NRR with a low GRR suggests a few large customers are expanding while many smaller ones leave. A high GRR with modest NRR suggests a stable base with little upsell. Neither is wrong, but the model should show which customers drive each number, and whether expansion depends on a single product module.
A Gurugram company reports NRR of 112 per cent, but 70 per cent of its expansion comes from three enterprise accounts. The model gives those accounts a separate line with a renewal probability, so the forecast does not assume the top three keep expanding every year.
Preparing for a Series A funding round?
Pressure-test ARR, retention, unit economics and cash runway before your next funding conversation.We can help turn the model into a clear, investor-ready view of the business.
Discuss your SaaS modelFinancial Modeling | Fundraising Support | Unit Economics
Mastering SaaS Unit Economics: The Engine of Valuation
Unit economics show whether each new customer creates value. The main measures are customer acquisition cost, its payback period, customer lifetime value and monthly churn. A company that grows fast on weak unit economics raises money at a lower price or runs short of cash, so investors check these figures early.
Customer Acquisition Cost (CAC) and CAC Payback Period
CAC is the total cost of winning new customers in a period, divided by the number of new customers won in that period. Include the salaries and commissions of the sales and marketing team, paid media, agency fees, events, sales tools and the share of overheads that supports selling. Leaving out the sales team’s salaries is the most common error, and it can make CAC look roughly half of its true value.
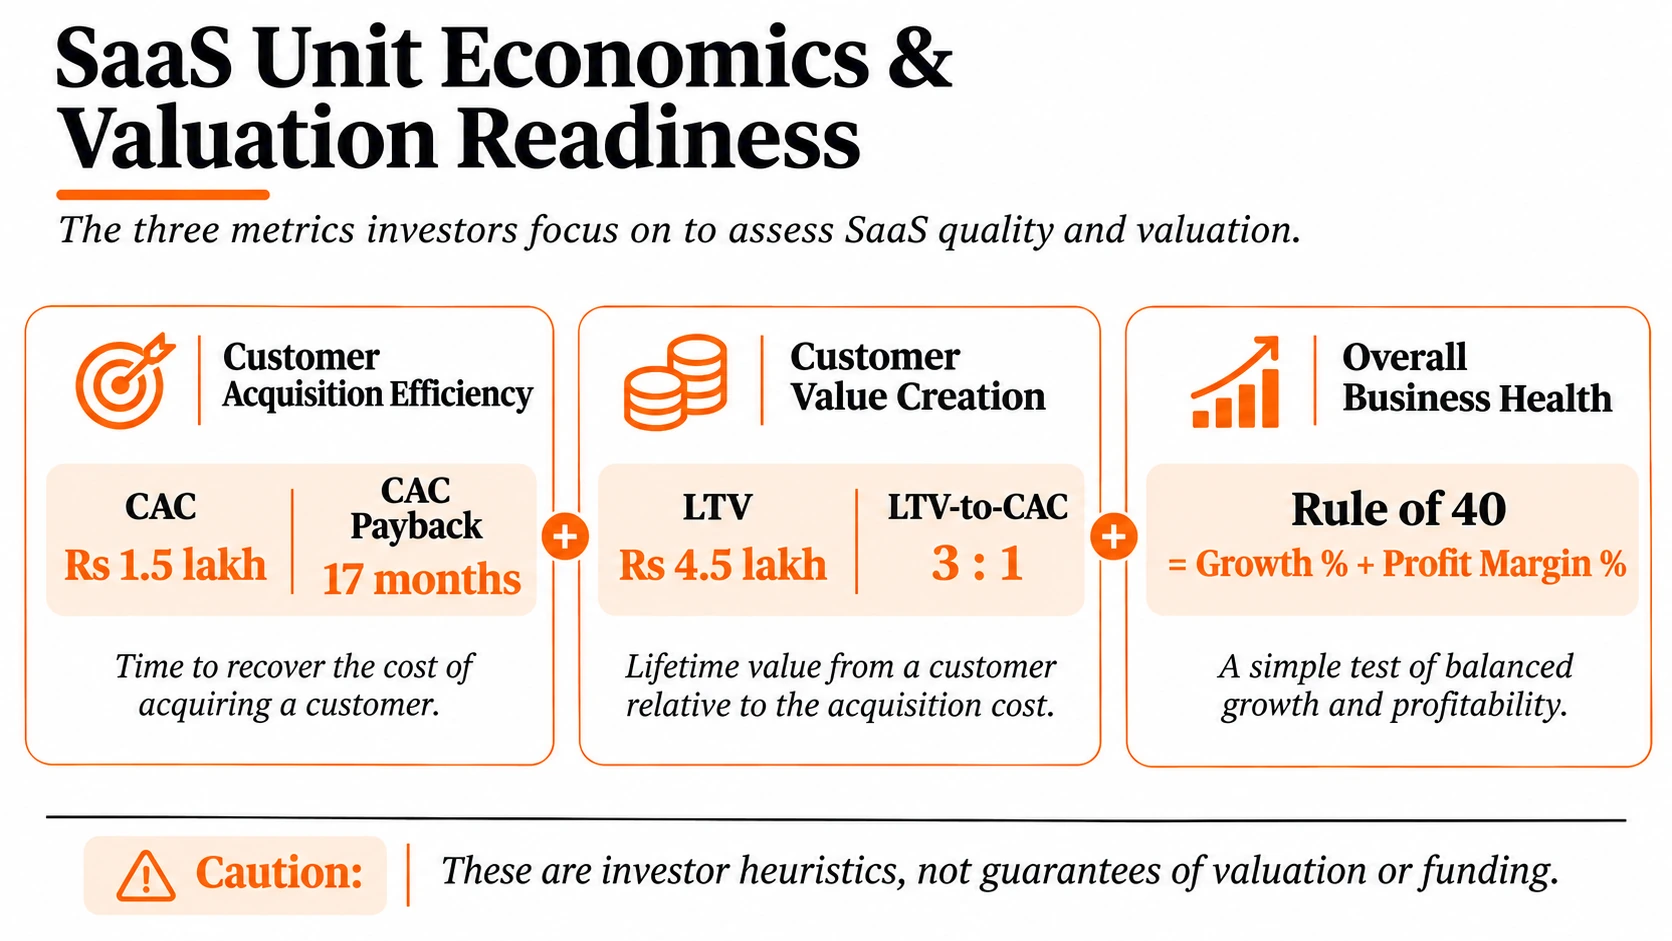
CAC payback is the number of months of gross profit from a new customer needed to recover its acquisition cost. Take a customer paying Rs 12,000 a month at a 75 per cent gross margin, which gives Rs 9,000 of gross profit each month. If the blended CAC is Rs 1.5 lakh, payback is about 17 months. Investors set this figure against the company’s cash and its funding plan. A payback longer than the runway is a warning, even when growth looks strong.
Lifetime Value (LTV) and Achieving the 3:1 LTV-to-CAC Ratio
A common formula for LTV is monthly gross profit per customer divided by monthly churn. On the figures above, monthly churn of 2 per cent gives an average customer life of 50 months and an LTV of Rs 4.5 lakh. Divided by a CAC of Rs 1.5 lakh, the ratio is 3 to 1.
The 3 to 1 ratio is a rule of thumb that many investors use as a first filter. It is not a standard, and it can mislead a company with very low churn, where the formula produces a large LTV that depends on years of retention nobody has observed. For a company with short history, cap the customer life at a figure the data supports, and show the ratio with and without the cap.
A Bengaluru company with two years of data caps its customer life at 36 months, not the 50 months its churn rate implies, because its oldest cohort has only 26 months of history. The ratio falls from 3.0 to about 2.2. The lower figure is the one the company can defend in the room, and it is more useful for setting the sales budget.
Tracking Monthly Churn and Its Impact on Runway
Monthly churn is the share of customers, or of revenue, lost in a month. A company with 2 per cent monthly logo churn loses about one customer in every fifty. The effect on runway is less obvious. Churn shrinks the revenue base that covers fixed costs, so each extra point of churn lengthens the time to break-even and raises the new sales needed just to stay level.
Model churn by segment and by contract type. Monthly customers leave faster than annual ones. A Pune SME tool sold on monthly plans and a Gurugram enterprise product sold on annual terms should show their churn separately. Link the churn line to the cash flow, so the investor can see how a change in retention moves the month in which cash runs out.
Benchmarks and Valuation Multiples in the Indian SaaS Market
Benchmarks show where a company stands, but they do not settle the answer. The Rule of 40 combines growth and profit margin as a quick screen. Revenue multiples move with growth, retention, gross margin and the market, so a published range is a starting point for discussion, not a price.
The Rule of 40: Balancing Growth and Profitability
The Rule of 40 adds a company’s revenue growth rate to its profit margin, usually EBITDA or free cash flow margin, and checks whether the total reaches 40 per cent. A Mumbai company growing 35 per cent with a 6 per cent EBITDA margin scores 41. Growth investors use the rule as a quick screen across companies of different sizes, because it lets a fast grower trade margin for growth without being judged too harshly.
Two cautions apply to Indian companies. Growth and margin are measured on different bases in different filings, and a company that reports adjusted EBITDA should say what it has excluded. A high score from one strong year can also hide a weak trend, so we show the score for each of the last three years, with its components.
Prevailing ARR Multiples for Indian B2B SaaS
Revenue multiples for SaaS companies move with the market, with interest rates and with the company’s profile. A business that grows fast, keeps most of its revenue and runs a healthy gross margin commands a higher multiple than one growing slowly with high churn. Private market reports and listed peers can show a range, but the figures differ by source, by year and by how the revenue base is defined.
For an Indian B2B SaaS company preparing a round, we start with the multiple implied by recent transactions in its segment, adjust it for growth, retention and margin against those comparables, and test the answer with a discounted cash flow built on the company’s own forecast. Where the two methods disagree sharply, the gap is usually an assumption about growth or margin that should be documented before the round opens.
A Delhi company with ARR of Rs 25 crore and 110 per cent net retention is compared with a peer growing at a similar rate but retaining only 95 per cent. The first company is not priced at the peer’s multiple. The retention gap is set out in the Valuation report, and the discount an investor applies is explained rather than assumed.
Need an independent Valuation for your SaaS startup?
Understand how growth, retention and margin support your valuation assumptions.Discuss a defensible, metric-driven report with our IBBI-Registered Valuers.
Request a Valuation discussionRegistered Valuation | Share Valuation | Financial Modeling
Frequently Asked Questions (FAQs)
What is a healthy LTV-to-CAC ratio for an early-stage Indian SaaS startup?
A ratio of 3 to 1 is a common benchmark, but it is a rule of thumb rather than a standard. For a company with limited history, the ratio depends heavily on the churn assumption, so most investors ask for it with a capped customer life and look at the trend across cohorts as well as the headline figure. A ratio below 3 to 1 with improving payback is often more convincing than a high ratio built on churn the company has not yet observed for long.
How do you forecast SaaS revenue using the bottom-up approach?
Start from sales capacity: the number of quota-carrying representatives, their ramp period, the opportunities each one handles, the win rate and the average contract value. Add expansion and churn from the cohort data, then reconcile the total to billings and collections. Every input should trace to the company’s own records, and the model should show how revenue moves when the win rate or the ramp period changes.
What is the difference between NRR and GRR in subscription models?
Gross revenue retention measures how much of a starting base is kept after churn and downgrades, and it cannot exceed 100 per cent. Net revenue retention also counts upsell and expansion revenue from the same customers. GRR shows how stable the base is, and NRR shows whether existing customers are growing the business. Investors read both, because a strong NRR can hide weak GRR when a few large accounts expand while many smaller ones leave.
How does the Rule of 40 impact a SaaS company’s Valuation multiple?
A company scoring above 40 generally commands a stronger multiple than one scoring below it, all else equal, because the score signals that growth and profitability are being balanced. The rule is a screen, not a formula. Two companies with the same score can be priced very differently if one grows fast with heavy losses and the other grows more slowly with strong cash generation. Investors look at the components as well as the total.
Why do venture capitalists prefer ARR multiples over EBITDA for SaaS?
Many SaaS companies are loss-making while they invest in growth, so EBITDA is negative or not meaningful. Recurring revenue is a cleaner measure of the business built so far, and investors use it to compare companies at similar stages. EBITDA becomes the more relevant measure as the company matures and its margins settle, and investors then move toward profit-based methods.
How do you account for deferred revenue in a SaaS balance sheet?
When a customer pays in advance, the company records the cash and a contract liability, which is the deferred revenue. Revenue is recognised as the service is delivered over the term, so the liability falls each month while recognised revenue rises by the same amount. The model should track billings, collections, opening and closing deferred revenue and recognised revenue, so the four reconcile every month. Check the treatment with the auditor for each contract type, especially where a contract bundles several services.
What is a good CAC payback period for B2B SaaS?
Many investors look for a payback well inside the company’s runway, and some use twelve to eighteen months as a working range for B2B software. The right answer depends on contract size, gross margin and segment. An enterprise company with large contracts can justify a longer payback than one selling small seats, provided retention is strong. Treat the range as a heuristic and show the trend across quarters.
How does the Income-tax Act, 2025 treat SaaS software development costs?
The Income-tax Act, 2025 took effect on 1 April 2026. The treatment of software development costs depends on whether the spending is revenue or capital in nature, how it is accounted for and which depreciation block the asset falls into under the new rules. Development costs may be capitalised under Ind AS 38 when its recognition criteria are met, but the tax treatment can differ. Confirm the position with a tax adviser before the model assumes a deduction or a depreciation pattern.
Build an investor-ready SaaS financial model.
Connect your revenue forecast, cohort metrics and cash plan in one model.Schedule a working session with Elite Valuation to review the assumptions.
Schedule a strategy sessionFinancial Modeling | SaaS Metrics | Fundraising
Sources
Official references for the accounting and tax points in this guide:
- Ind AS 115: Revenue from Contracts with Customers, published by the Ministry of Corporate Affairs, for subscription revenue and contract liabilities.
- Ind AS 38: Intangible Assets, published by the Ministry of Corporate Affairs, for internally generated development costs.
- CBDT press release: Income-tax Act, 2025 effective 1 April 2026.
- Finance (No. 2) Act, 2024, section 23, which made section 56(2)(viib) inapplicable on or after 1 April 2025.
- The LTV-to-CAC ratio, the Rule of 40 and the CAC payback range are investor heuristics. They are not statutory and are not drawn from a single published source.
Disclaimer. This article is general information only. It is not legal, tax, accounting or investment advice, and it is not a determination of any person’s position or of any application. The sources include official legal and accounting material; the investor benchmarks are heuristics rather than regulatory standards. The scenarios and the numbers in the illustrations are hypothetical and invented for explanation. Tax rules, accounting standards and regulator circulars change, so confirm each point against the current text with your adviser before relying on it. Research date: 14 November 2026.