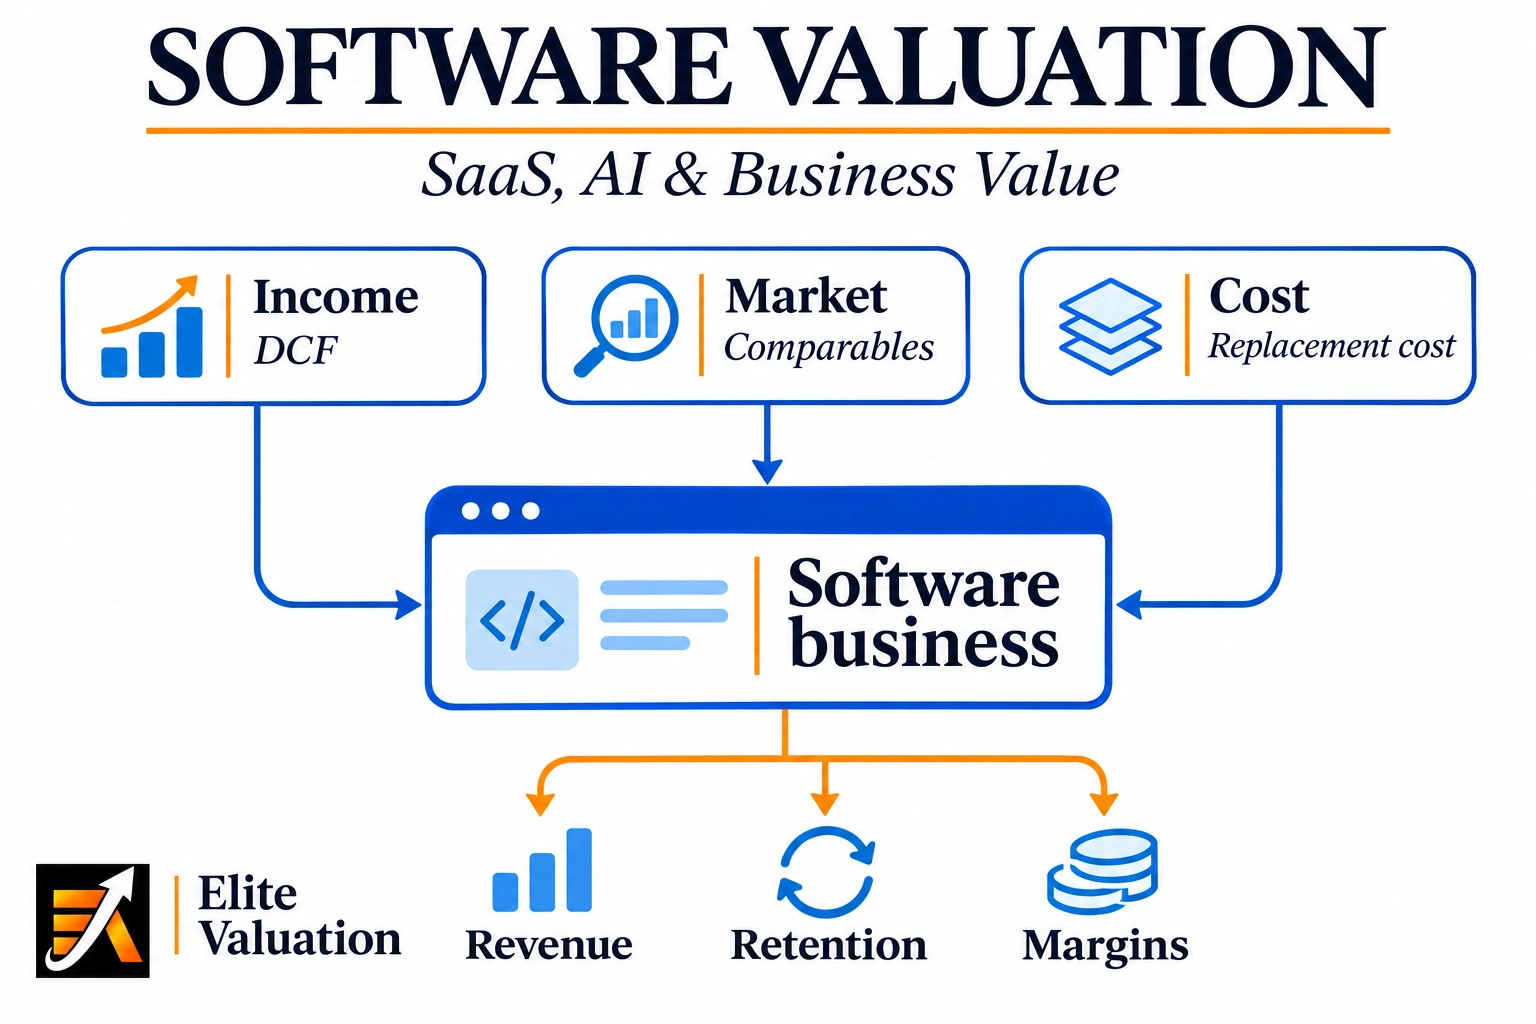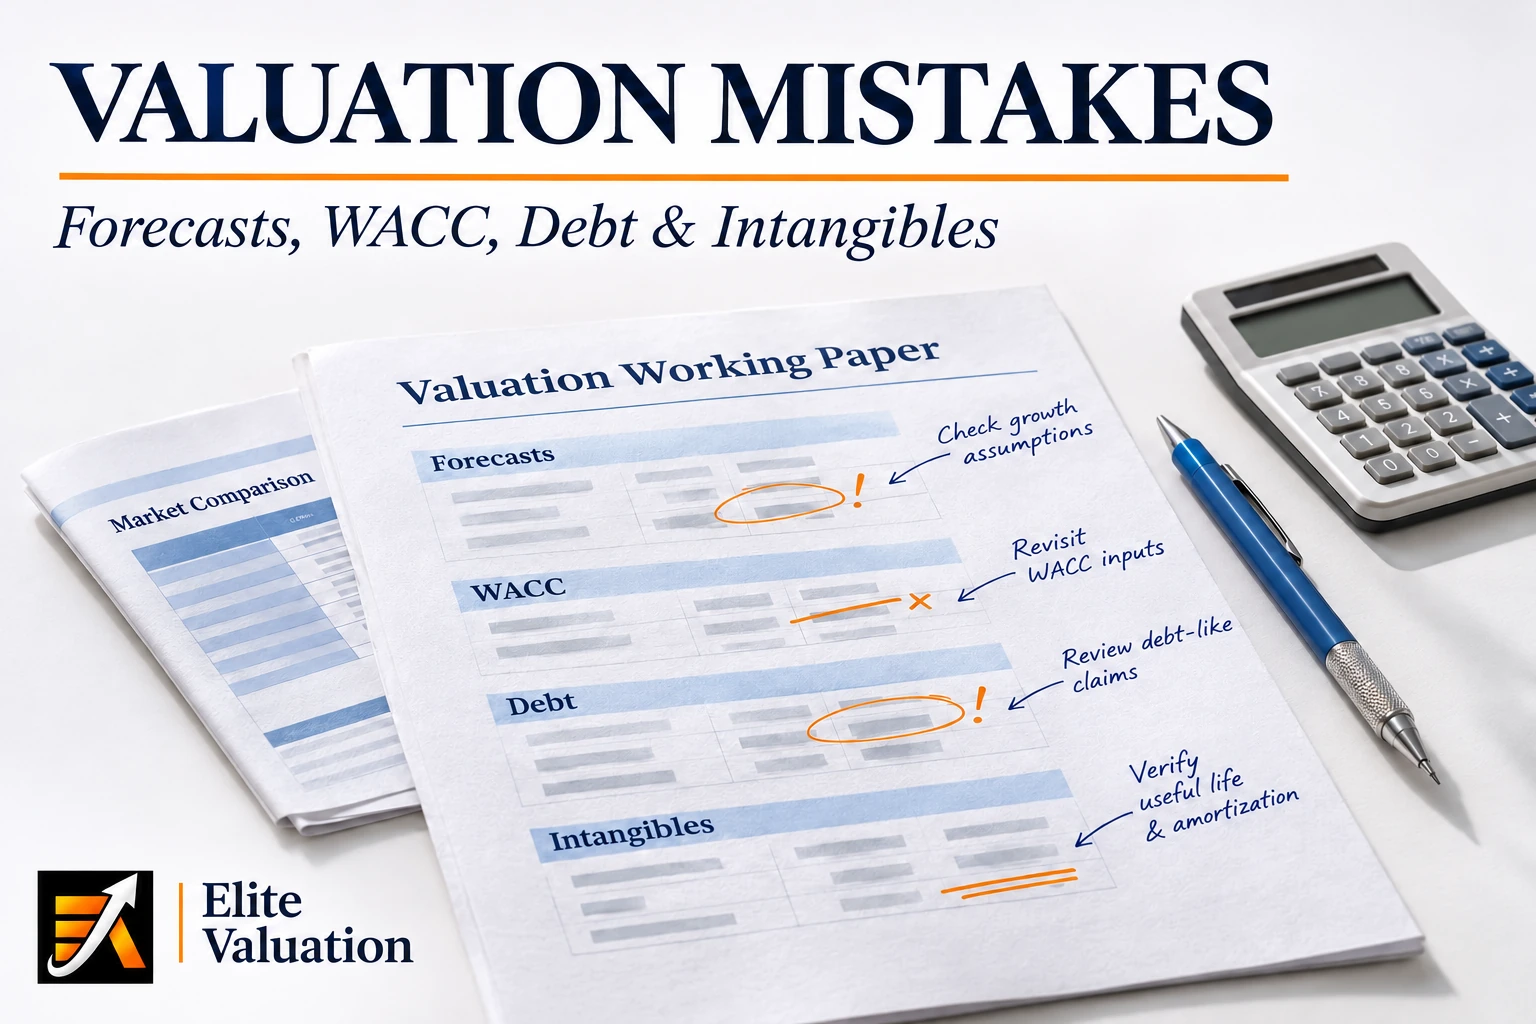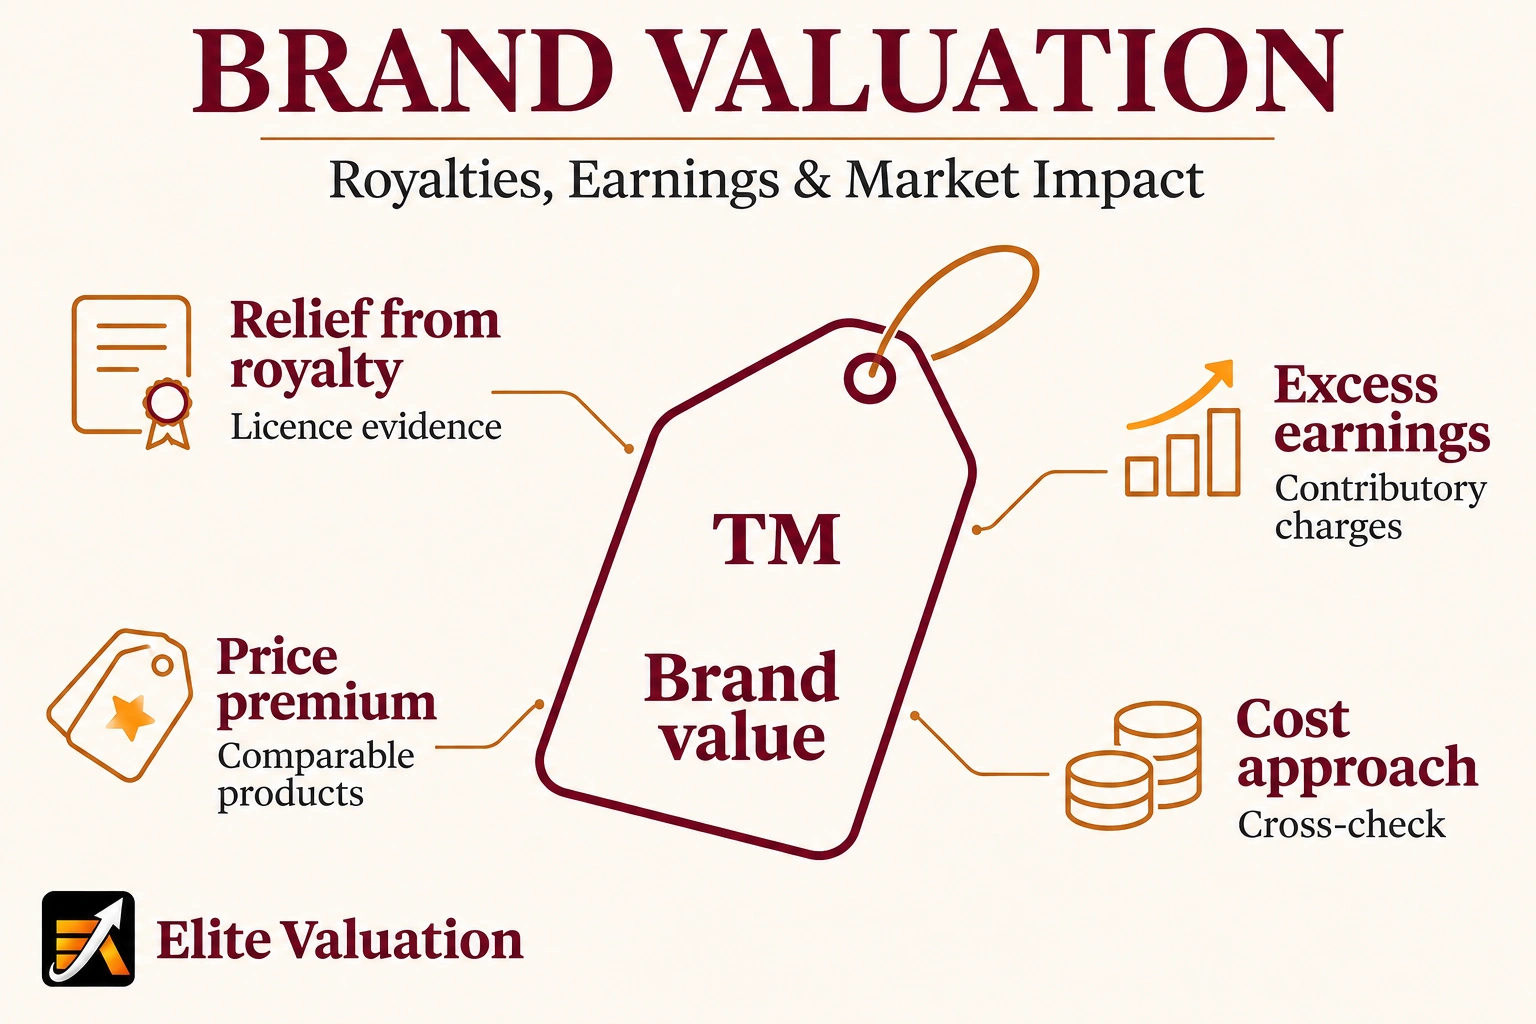
The three Corporate Valuation methods used most in India are DCF, Market Multiples and Asset-Based approaches, and most Indian companies do not fit any one of them neatly. Each answers a different question and fails in a predictable way when applied to the wrong business. Compared side by side, they show where value comes from, where each method breaks down, and why a defensible result usually reconciles more than one.
Key takeaways
- Match the method to the business. DCF suits cash-generative companies, multiples suit sectors with reliable peers, and asset-based methods suit asset-heavy structures.
- Test the terminal value first. In most DCFs it carries the majority of the result.
- Adjust peer multiples. Listed peers need adjustments for size, growth, margins and marketability before they are applied.
- Treat NAV as a floor or a specialist method. It rarely captures the earning power of an operating business.
- Reconcile the methods in writing. Explain why the final range sits where it does.
- Confirm the regulatory method rules. Ind AS 103, FEMA and Rule 57 each set their own requirements.
Discounted Cash Flow (DCF): The Income Approach
A DCF estimates what a business is worth today by discounting its expected free cash flows at a rate that reflects their risk. It is the most rigorous method when the forecasts are credible, and the most easily distorted when they are not.
Core Principle: Valuing Future Earning Power
The DCF rests on one idea: a business is worth the present value of the cash it will generate for its owners. The valuer forecasts free cash flow over an explicit period, usually five to ten years, discounts each year at the weighted average cost of capital (WACC), and adds a terminal value for the period beyond the forecast. The terminal value is typically calculated with the Gordon growth formula, which divides the final year’s cash flow, grown at a long-term rate, by the gap between the WACC and that growth rate.
Figure 1 uses a hypothetical company whose cash flows rise from ₹10 crore to ₹18 crore over five years, with a 14% WACC and 6% terminal growth. The explicit forecast accounts for about a quarter of the enterprise value. The rest comes from the terminal value.
Best Suited For: Cash-Generative Businesses with Defensible Forecasts
The DCF fits businesses with a record of positive operating cash flow, visible drivers of growth and a stable cost structure. Manufacturers with long-term contracts, established software businesses with recurring revenue and infrastructure assets with contracted tariffs are typical candidates. A business with a three-year order book and documented capacity expansion can support a DCF. An early-stage company with two years of trading and no pricing history usually cannot, however carefully the model is built.
Limitations: High Sensitivity to Assumptions Such as Terminal Growth
Small changes in the terminal growth rate or the WACC move the answer materially. Figure 2 keeps the explicit forecast and the 14% WACC constant and changes only the terminal growth rate. Moving growth from 6% to 5% lowers the value by about 9%, and moving it to 7% raises the value by about 11%. That swing is larger than most negotiating ranges, which is why the terminal assumptions need the most documentation.
Market Multiples: The Comparable Company Analysis
Market multiples value a company by applying the pricing ratios of comparable companies to its own financial metrics. They reflect what investors pay today, which makes them a useful cross-check and sometimes the primary method.
Common Multiples in India: EV/EBITDA, P/E and EV/Revenue
EV/EBITDA is the most widely used multiple for operating businesses, because it is independent of capital structure and tax position. P/E is common for profitable companies valued on equity earnings, and it is the natural reference for listed equity. EV/Revenue is used for loss-making or early-stage businesses whose earnings are not yet meaningful, although it ignores margin differences and must be applied with care. Each multiple is calculated from a peer set and then applied to the matching metric of the target.
Best Suited For: Businesses with Readily Available Listed Peers
Multiples work best where the sector has a deep listed market and the target shares its business model, size band and growth profile. Listed companies in consumer goods, cement and IT services usually provide enough reference points. Banks and financial companies are generally valued on price to book rather than EV/EBITDA. Recent transactions in the same sector give a second reference, although a control premium may apply and the timing and terms of each deal must be checked. Every multiple must come from current market data, not from a range remembered from an earlier year.
Limitations: Finding Genuinely Comparable Peers in the Indian Private Market
The practical difficulty in India is finding peers. Most private companies have no listed twin, and listed peers are often much larger, more liquid or more diversified. Their multiples must be adjusted for size, growth, margin and the discount for lack of marketability that applies to unlisted shares. Without those adjustments, the answer reflects the peer set rather than the target.
A private manufacturer with EBITDA of ₹25 crore is compared with three listed peers. Two are far larger and more liquid, and the third has a more diversified product mix. Only the adjusted multiple, reduced for size and marketability, is applied to the target. Each adjustment is written down with its reason, so a buyer can challenge the number and the reasoning behind it.
Asset-Based Valuation (NAV)
The asset-based approach values a business as the fair value of its assets less its liabilities. It captures what the business owns, but it ignores earning power unless that power is separately recognised, so it works best where assets drive the economics.
Core Principle: Fair Value of Assets Less Liabilities
Under this approach, each asset and liability is restated to fair value, and the net figure is the equity value. Real estate is revalued at market value, investments at their market or fair value, and liabilities include contingent claims where they are probable. Ind AS 113 recognises the cost approach as one of its three Valuation approaches. It is the approach used when value is best measured by what it would cost to replace an asset’s service capacity.
Best Suited For: Real Estate, Holding Companies and Distressed Businesses
The asset-based approach is the natural method for real estate companies, investment and holding companies, and businesses being wound up or restructured, where break-up value matters more than a going concern. In distressed situations it sets a floor, because a buyer will rarely pay less than the realisable value of the assets. For operating businesses it usually understates value, since goodwill, brands, customer relationships and a trained workforce are not separately recorded as assets. Rule 57 of the Income-tax Rules, 2026 uses net asset value as the principal approach for unquoted equity shares, which is one reason the method appears so often in Indian filings. Confirm the notified text before relying on it for a specific purpose.
Why Triangulation Is the Best Strategy
Triangulation means reconciling the answers from two or more methods, then explaining where the final range sits and why. It is the strongest defence available, because the conclusion no longer rests on a single set of assumptions.
How Combining DCF and Multiples Strengthens Credibility and Reduces the Risk of Error
A DCF shows what the business is worth on its own forecasts. Multiples show what the market is paying for similar businesses today. When the two ranges overlap, the overlap is strong evidence. When they diverge, the gap points to the assumption that needs investigation: either the forecast is more optimistic than the peers, or the peers are not comparable. Figure 3 uses the same hypothetical company as Figures 1 and 2. The DCF range is 155 to 189, the adjusted multiples range is 140 to 175, and the asset-based range is 90 to 110. The reconciled range of 160 to 175 sits where the first two overlap, and the asset value is used as a floor check rather than averaged in.
The cross-method illustration assumes nil net debt solely to make its enterprise-value and NAV figures comparable.
The reconciled range is a judgement, and the report must say so. A figure that cannot be explained method by method will not survive a buyer’s review.
Choosing the Right Method for Your Regulatory Needs
The method is not chosen on the economics alone. The purpose of the Valuation sets the rules, so the method must satisfy the regulation that applies to the transaction as well as the business facts.
Ind AS 103 governs the purchase price allocation in a business combination. Identifiable assets and liabilities are recognised at fair value, and intangibles such as technology and customer relationships are usually valued with an income approach, for example relief from royalty or multi-period excess earnings. Tangible assets such as property typically use market or cost approaches. Ind AS 113 ranks the inputs to a fair value measurement from observable market data to unobservable assumptions, and the disclosures should show which level applies.
For shares issued to or acquired from non-residents, the Foreign Exchange Management (Non-debt Instruments) Rules, 2019 set pricing guidelines and require the price to be certified by a qualified professional. The accepted methods and the certificate requirements should be confirmed against the current rules before a DCF-based price is relied on.
For tax purposes, Rule 57 of the Income-tax Rules, 2026 prescribes fair market value for unquoted equity shares, with net asset value as the principal approach. Secondary commentary does not settle whether a DCF can be used under the rule for unquoted shares, so that point must be confirmed against the notified text.
Valuation methods at a glance
| Method | Best suited for | Main limitation | Key Indian reference |
|---|---|---|---|
| DCF (income approach) | Cash-generative businesses with defensible forecasts | Sensitive to WACC and terminal growth | Ind AS 103 and 113; FEMA pricing rules (confirm) |
| Market multiples (market approach) | Sectors with listed or recent-transaction peers | Peer comparability and marketability | Ind AS 113 market approach; banks on price to book |
| Asset-based (NAV or cost approach) | Real estate, holding companies, distressed businesses | Ignores earning power not recorded as assets | Rule 57 NAV for unquoted equity (confirm) |
Need the Right Method Documented for Ind AS 103, FEMA or Tax Reporting?
We select and reconcile the method for each purpose, document the inputs and explain the conclusion so that a statutory auditor, regulator or buyer can test it. Elite Valuation prepares purchase price allocations, FEMA pricing and tax Valuations as an IBBI registered valuer firm.
Discuss Your Valuation MethodInd AS 103 PPA | FEMA Valuation | Tax Valuation | Company Valuation
Frequently Asked Questions About Corporate Valuation Methods
Which Corporate Valuation method is best for Indian companies?
No single method is best for every company. The right choice depends on the quality of cash flow forecasts, the availability of comparable companies and the asset base. A DCF suits cash-generative businesses, multiples suit sectors with reliable peers, and asset-based methods suit asset-heavy or holding structures. Most defensible Valuations use more than one method and explain the result.
What is the difference between DCF and market multiples?
A DCF estimates value from the cash a business is expected to generate, discounted to today at a risk-adjusted rate. Market multiples estimate value by applying the pricing ratios of comparable companies to the target’s earnings or revenue. The DCF reflects company-specific prospects, while multiples reflect what investors currently pay for similar businesses.
When should a DCF not be relied on?
Treat a DCF with caution when the company has no reliable cash flow history, when the forecasts cannot be supported by contracts, orders or market data, or when the terminal value makes up most of the result without a clear basis for the long-term growth rate. In those cases the DCF should be one input among several.
Which multiples are most common in India?
EV/EBITDA is the most widely used for operating businesses because it is independent of capital structure. P/E is common for profitable companies valued on equity earnings. EV/Revenue is used for loss-making or early-stage businesses, although it ignores margin differences. Banks and financial companies are generally valued on price to book.
How are comparable companies chosen for a private business?
Start with listed companies in the same sector, size band and growth profile, then add recent transactions where they exist. Adjust each peer multiple for size, growth, margin and the discount for lack of marketability that applies to unlisted shares. Record each adjustment and its reason so that the selection can be tested.
When is an asset-based Valuation appropriate?
It is appropriate for real estate companies, investment and holding companies, and businesses being wound up or restructured, where break-up value matters. It also sets a floor in distressed situations. For operating businesses it usually understates value, because goodwill and unrecorded intangibles are not reflected in net assets unless they are identified separately.
Does an asset-based method capture brand and technology value?
Only if those assets are identified and measured separately. Internally generated brands and technology are often absent from the balance sheet, so a simple net asset calculation omits them. An income approach, such as relief from royalty, is usually needed to value them within a transaction.
Why is triangulation recommended?
Triangulation shows whether independent methods point to a similar value. When they do, the conclusion rests on more than one set of assumptions. When they diverge, the gap identifies the assumption that needs investigation. The final range should be explained in writing, including the reason for weighting one method above another.
Which method do Indian regulations require?
The method depends on the purpose. Ind AS 103 requires fair value for acquired assets, FEMA pricing rules set requirements for shares issued to or acquired from non-residents, and Rule 57 of the Income-tax Rules, 2026 prescribes fair market value for unquoted equity shares, with net asset value as the principal approach. The current notified text should be checked for each purpose.
Can a company use different methods for accounts and for a transaction?
Yes, because the purpose differs. Fair value under Ind AS and a transaction value may use different inputs and assumptions. Where both are needed, the differences should be reconciled in writing, so that the accounts, the tax position and the deal price can be explained consistently.
Sources
- Ind AS 103 Business Combinations and Ind AS 113 Fair Value Measurement, Ministry of Corporate Affairs.
- Foreign Exchange Management (Non-debt Instruments) Rules, 2019, pricing guidelines and certification requirements; confirm against the current text.
- Income-tax Rules, 2026, Rule 57 (previously Rule 11UA); the notified text must be confirmed for the DCF position on unquoted shares.
- Insolvency and Bankruptcy Board of India, registered valuers and Valuation standards: ibbi.gov.in

Disclaimer. General information only, not legal, tax, accounting or investment advice, and not a Valuation of any company or security. All figures and scenarios are hypothetical, and regulatory points must be confirmed against the notified text. Research date: 9 November 2026.